Pseudocolor implementation with OpenCV.
In Computer Vision works in a lot of cases with gray images because there are a lot of motives. But human vision don't perceives the gray levels so well as color levels.
Then if we need show a image to a person, we can color it. But, how is the best way to coloring gray image?
There are 3 ways to do it: Manually, automatically and colored by ranges.
In this tutorial, i go to develop the way most common automatic for gray image coloring.
To do it we need know we go to receive a gray level and we need return 3 values, one for red, one for blue and other for green.
We go to use this function:
$$ \displaystyle{ s(x,y)=\vert sin(r(x,y)*p*PI + \Theta*PI)\vert}$$
And r(x,y) is the gray level and p is the number of repetitions and $ \displaystyle{ \Theta }$ is the displacement.
Then we only need define the p and $ \displaystyle{ \Theta }$ for each channel.
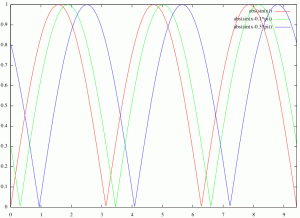
If we create a plot with this function with this parameters for red, green and blue ((2,0),(2,-0.1),(2,-0.3)) we get:
Pseudocolor Graph with red(p=2,theta=0) green(2,-0.1) and blue(2,-0.3)
Then we only need set the gray level in range 0 to 1 and the sine returns values from 0 to 1 we interpret as float image values or we set in range 0 to 255.
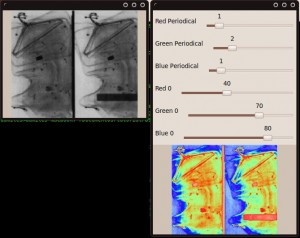
To finish this is the result:
